Process
Structured civic infrastructure
We normalize parcel records, zoning, permits, elections, and other public sources into a single system with no PDFs, no silos.
Place data · Planning · Public records

OpenSkagit is the foundational model, the thinking layer for Skagit Valley—turning fragmented information into clear answers, practical tools, and shareable reports grounded in real data.
Real-time signals from active datasets and pipelines.
How it works
We grab scattered local data—permits, parcels, shorelines, zoning—and connect the dots that aren't obvious when you look at them separately.
Flip card for details.Anacortes: Shoreline permits + water quality data show what's really happening along the coast
Burlington: Building permits crossed with floodplain maps reveal where growth is pushing into risky areas
County-wide: Property sales linked to zoning changes track where development is actually heading
We make tools that turn messy local data into something you can actually use, showing how decisions ripple through your community.
Flip card for details.Permit timelines: See how long different projects actually take and where things get stuck
Zoning impacts: Map how code changes affect what can get built in your neighborhood
Growth patterns: Track where development is piling up and what it means for roads, schools, and services
We train a local-first AI on Skagit Valley's unique context, so it can think about place, policy, and community like someone who's lived here for years.
Flip card for details.Ask complex questions: "How might new stormwater rules affect downtown Sedro-Woolley redevelopment?"
Surface connections: Links between watershed health, farmland conversion, and housing policy
Built-in accountability: Cites parcels, permits, and sources so you can check every claim
Watch us build tools that make Skagit Valley's data actually useful and see what we're discovering along the way.
Built to be used. New tools and datasets roll out continuously.
A parcel-first view of Skagit Valley: key facts, mapping layers, and location-aware insights in one place.
What people are talking about, what’s rising, what’s fading—built from menus, reviews, and real patterns across the Valley.
VoteVector analyzes voting behavior through a neighborhood lens—connecting ballots, parcels, and geography to surface meaningful engagement patterns.
Connect AI assistants to Skagit Valley property + planning data through simple tools.
Parcel Profiler surfaces constraints, risk signals, and smart next steps for any property so you know what’s behind the headline.
Clear breakdown of property taxes with trend context and plain-English explanations of what changed.
Agenda and document summaries tagged by impact area—housing, flood, roads, taxes, business—with links back to sources.
How we work
These tight signals describe how we collect, contextualize, and translate civic data into tools that help people understand the Valley without digging through PDFs or silos.
Process
We normalize parcel records, zoning, permits, elections, and other public sources into a single system with no PDFs, no silos.
Place data · Planning · Public records
Spatial intelligence
Patterns surface when every record links to parcels, neighborhoods, or districts—so we can compare where pressure concentrates and participation shifts.
Parcels · Neighborhood context · Maps
Signals
We transform raw tables into interpretable indexes, classifications, and confidence-weighted summaries that stay transparent and source-linked.
Indicators · Comparisons · Confidence
AI augments specific workflows—it doesn’t replace data provenance. Here’s where we apply it, with humans reviewing the results.
Models help detect anomalies in assessments, menu sentiment swings, and zoning changes. We feed them structured joins, let them spot patterns, then log the output for auditors.
Briefings and parcel narratives start with AI summaries, but every paragraph keeps citations, timestamps, and clear uncertainty labels before publication.
We use AI pair-programming to scaffold ETL scripts, QA checks, and regression dashboards—always reviewed in Git before they touch production pipelines.
For explorations—“what if we map parcel preflight constraints?”—AI helps storyboard, but the decision to ship still depends on real data coverage and community impact.
Interactive city-specific mapping projects built from local parcel, zoning, and planning data.
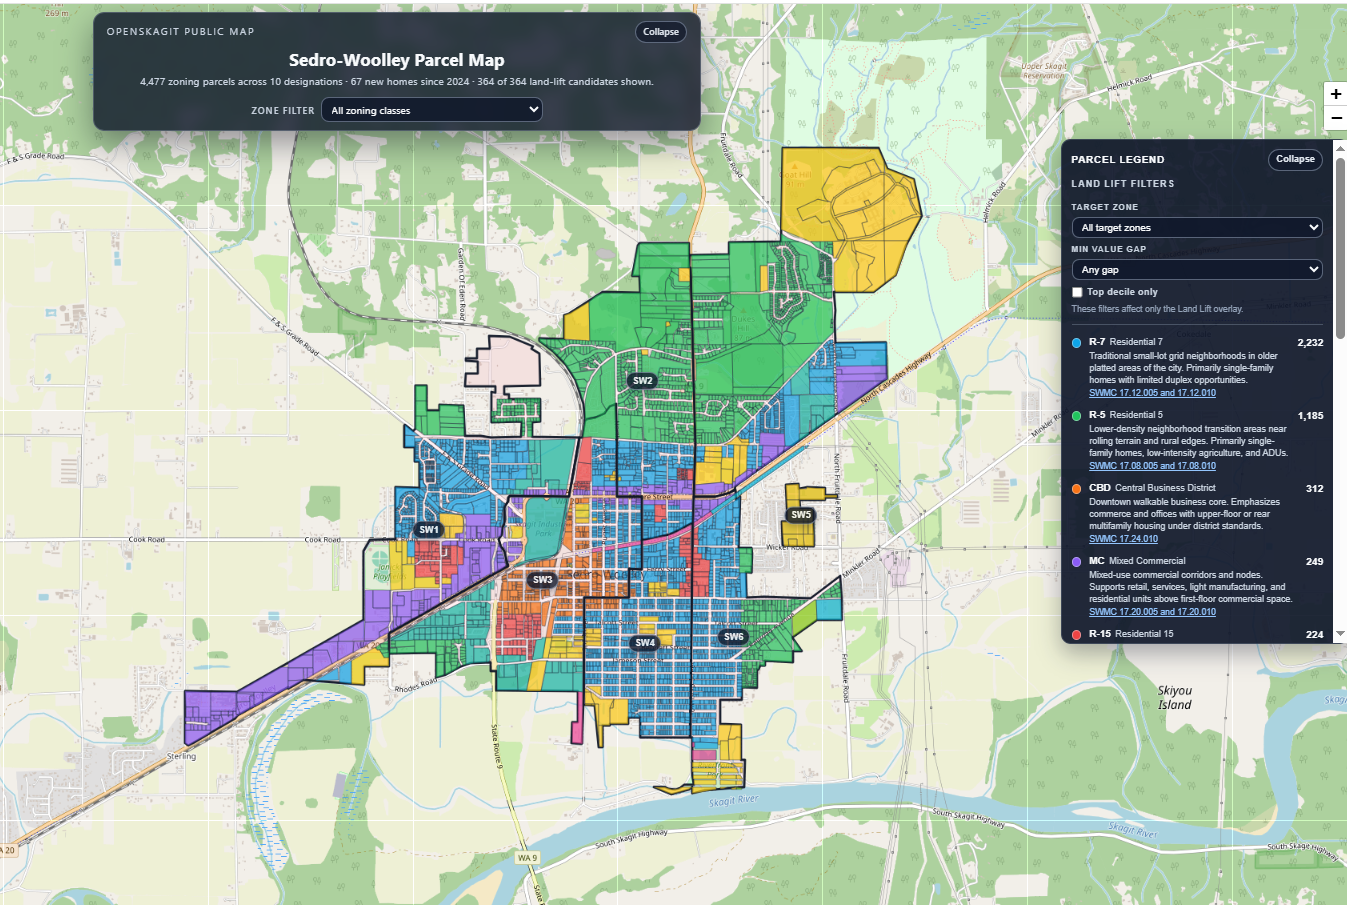
Featured map
Zoning filters, land-lift candidates, and parcel-level context in one interactive view.